-
E-mail
879367234@qq.com
-
Phone
18861632831
-
Address
No. 5 ASEAN Road, ASEAN Science and Technology Industrial Park, Nanzha Town, Jiangyin City, Jiangsu Province
Jiangsu Ankerui Electric Appliance Manufacturing Co., Ltd
Application and Analysis of Intelligent Instruments in Terminal Energy Management System
Date: 2025-10-13Read: 9
Abstract: Energy conservation and emission reduction are of great significance to both the country and society. Civil airport terminals are major energy consumers, and electricity consumption is one of the important energy-saving indicators of airport terminals. Based on the actual case of an airport energy management improvement and renovation project, this article first analyzes the existing energy management problems in the terminal building. Secondly, it introduces the specific implementation method of using intelligent instruments to improve the energy management system and the design scheme of intelligent instruments in the terminal building. Then, the functions of the energy management system are analyzed again. Finally, energy consumption analysis is conducted to evaluate the energy-saving effect of intelligent instruments applied in the terminal building energy management system, in order to provide reference for related projects.
Keywords: smart meter; Energy management; energy conservation and emission reduction
0 Introduction
Shipping is an important component of China's transportation system and a rapidly developing field in comprehensive transportation. In the past few decades, due to population growth and economic expansion, the aviation industry has developed rapidly, and our industry's development speed is much higher than the global average speed. From 2015 to 2019, the average annual growth rates of China's total transportation turnover, passenger transport volume, and freight and mail transport volume were 11.0%, 10.7%, and 4.6%, respectively. In 2019, the carbon dioxide emissions from commercial air transportation in China reached 116.58 million tons, almost three times the emissions in 2009 (41.52 million tons). According to the Action Plan for Building a Strong Country, the per capita number of air trips in China will exceed one by 2035. According to this goal, the growth rate of the industry scale after 2030 still needs to maintain a medium speed or above (0.47 in 2019). With the steady growth of industry transportation turnover, fleet size, and number of airports, the total carbon emissions are bound to increase accordingly. How to reduce aviation carbon dioxide emissions will be an important issue that China needs to address.
A large international hub airport has been operating at a high energy consumption level for many years with the continuous increase in passenger volume and improvement in service level. The total costs of electricity, heating, air conditioning, and steam for the three terminals of the airport from 2017 to 2019 were 560 million yuan, 575 million yuan, and 546 million yuan, respectively. Among them, electricity, heating, and air conditioning costs accounted for 97% of the total energy costs of the terminals and were important expenditures for energy consumption in the three terminals. The average annual energy cost of airport terminals from 2017 to 2019 was 560 million yuan, of which electricity consumption accounted for 36% and the annual electricity consumption was about 200 million yuan. Therefore, studying the improvement of energy management level in terminals has important economic significance.
Existing energy management issues in Terminal 1
1.1 End of line electrical equipment cannot be remotely monitored
(1) There are a large number of personal high-power electrical devices for employees in the office area of the terminal building, such as electric kettles, microwaves, electric heaters, etc. These devices have not been registered and there is no effective remote monitoring method, which brings great safety hazards and energy consumption to the terminal building.
(2) There are numerous charging devices for passengers and employees in the terminal building. Due to the lack of intelligent monitoring equipment, the existing energy management system cannot achieve remote charging management, often resulting in overcharging and unauthorized charging, which also poses fire safety hazards and energy consumption.
(3) There is a phenomenon of private and disorderly wiring in the terminal, and these wires and electrical equipment are all located in concealed areas inside the terminal, which are difficult to detect during regular inspections and can easily cause fires, posing significant safety hazards to the terminal.
In short, there are a large number of unregulated terminal electrical equipment in the terminal building, which cannot be effectively remotely monitored through the existing energy management system, resulting in issues such as electricity safety and waste.
1.2 Energy waste in air conditioning and lighting systems
The existing air conditioning system in the terminal is controlled by a single unit operation mode, and there is no linkage between the units. In order to meet the cooling requirements of densely populated areas, most of them use high power cooling or air supply, which leads to excessive cooling in many areas and serious energy waste. At the same time, the fan coil equipment in all areas of the terminal building (shops, office areas, etc.) has not been remotely monitored, which may result in the operation of refrigeration equipment in unmanned areas, leading to energy waste.
At present, the control mode of the lighting system in the terminal is time controlled, which is turned on and off according to the set schedule. However, in reality, due to the large scale and complex area of the terminal building, the lighting requirements and conditions of each functional area are not the same. Controlling the lighting system according to the schedule cannot better utilize natural light, resulting in energy waste.
1.3 Energy waste caused by excessive transformer capacity
According to on-site measurements, the actual operating load rate of the transformer is very low, about 30%. This is also one of the common problems in the current terminal power supply and distribution system. For example, the high operating load rate of transformers in Terminal 1 of Guangzhou Baiyun Airport is 27.3%~36%, which is 55%~72% of the design value. The root cause of this problem lies in the fact that the design phase often needs to consider the long-term development needs, and the demand coefficient taken in load calculation is too large, resulting in a conservative design and leading to an excessive design capacity of the transformer.
Excessive transformer capacity can result in higher annual operating costs and energy waste. This is mainly reflected in two aspects: ① The no-load loss of transformers is high, and the annual energy loss is large. The no-load loss power of transformers of the same model is generally proportional to the transformer capacity. ② The annual maintenance cost of transformers is high. The annual maintenance cost of a general substation is taken as 1% of the initial investment cost of the transformer, and the initial investment of the transformer is directly proportional to its capacity.
This article mainly aims to achieve energy conservation by installing intelligent instruments to monitor and control end use electrical equipment, and does not currently study the energy-saving effect of replacing transformers.
2. Improve energy management system with the help of intelligent instruments
In response to the problem of ineffective control over energy waste in the terminal building, it is proposed to study the existing power supply and distribution system in the terminal building, effectively add intelligent monitoring terminals in the terminal or distribution system, and then upload the terminal data to the energy management system through the data transmission network. At the same time, the energy management system can be used to monitor and control the energy consumption of terminal equipment. Therefore, it is necessary to build a unified energy management system that covers the infrastructure layer, system platform layer, and software application layer.
2.1 Specific Implementation Methods
(1) Sort out the existing power supply and distribution system of the terminal building, collect energy data of all electrical equipment in the terminal building by adding intelligent instruments, replacing intelligent circuit breakers, replacing intelligent terminals, etc., and transmit the data to the energy management system using the terminal building's wired or wireless network.
(2) Integrate the existing building equipment monitoring and management system, power monitoring and management system, and intelligent lighting monitoring and management system into the existing energy management system of the terminal building.
The terminal IoT electromechanical operation and control platform consists of a software platform, data integration interface, management layer network equipment, wireless access gateway, and end devices.
2.2 Terminal Intelligent Instrument Design Scheme
(1) Renovation plan for power equipment in the substation and distribution room. At present, the substation only monitors the voltage and current of the transformer output circuit. This time, it is planned to install intelligent instruments to monitor all output circuits. At present, all outgoing circuits are equipped with ammeters and current transformers. The three wire voltage at the upper end of the circuit breaker in this circuit is connected to the intelligent instrument through the fuse terminal, and the current at the secondary end of the current transformer is connected to the intelligent instrument. The auxiliary contact of the circuit breaker switch status is connected to the remote signaling terminal of the intelligent instrument. Smart meters upload data to the energy management system through a data transmission network.
(2) Lighting system. The lighting distribution system (Figure 1) is equipped with a lighting main cabinet, floor cabinets, lighting distribution boxes, and socket distribution boxes.
Figure 1 Lighting Distribution System
Both the main cabinet and the floor cabinet are equipped with incoming transformers and incoming ammeters. Intelligent instruments are installed on the incoming lines, and the installation plan for intelligent instruments is the same as that for the substation room. Wireless transmission is used for data transmission. The incoming line of the end distribution box is a miniature circuit breaker, and a 2P card rail smart meter is installed to complete the power monitoring transformation. The card rail smart meters are all direct meters, and the incoming cable needs to be connected to the card rail smart meter for data transmission through the data transmission network.
(3) Power distribution system. The main power cabinet is equipped with incoming transformers and incoming ammeters, and intelligent instruments are installed on the incoming lines. The installation plan for intelligent instruments is the same as that for the substation room. The incoming line of the cabinet is not equipped with an ammeter and a transformer. In this case, an open transformer will be added at the incoming line to collect current signals, and the intelligent instrument will be installed with a hole on the cabinet door. Utilize data transmission networks for data transmission.
(4) Air conditioning distribution system. Each air conditioning unit comes with a local control cabinet, and the air conditioning main cabinet is equipped with an ammeter and a transformer for the incoming line. The incoming line is equipped with an intelligent instrument, and the renovation plan is the same as the distribution cabinet with an ammeter as mentioned earlier. Each air conditioning unit is equipped with an intelligent instrument installed in the control cabinet next to the unit. The current signal is collected by setting an open transformer for the incoming line. The intelligent instrument is installed on the cabinet door, and data transmission is done wirelessly.
3 Functions of Energy Management System
The design goal of the energy management system is to achieve monitoring, control, and optimization of various energy consumption in the terminal building, and to scientifically analyze the operation of key energy consuming equipment and the energy pipeline network to assist decision-making. The energy management system focuses on three very important issues: monitoring, analysis, and management, which are also the foundation for the application of all energy-saving measures.
3.1 Monitoring
With the rapid development of computer technology, network technology, fieldbus technology, and measurement and control technology, traditional energy management systems are moving towards intelligent measurement and control, unmanned monitoring, and networked information exchange. Realize 24-hour fully automatic energy data collection through wired and wireless networks, obtain accurate basic energy data, and rely on data storage technology to achieve long-term data storage, laying a solid foundation for energy efficiency analysis.
3.2 Analysis
On the one hand, a series of methods such as sub item measurement, equipment fault query, and energy consumption trend prediction are applied to mine effective energy data from the energy data center database, analyze key energy efficiency indicators, and provide effective data support for formulating energy-saving plans; On the other hand, by searching for system vulnerabilities, adjusting equipment operation strategies, and optimizing energy consumption time, energy problem points can be analyzed to provide effective tools for optimizing energy-saving plans and energy management systems.
3.3 Management
The successful achievement of energy-saving goals not only depends on reasonable and effective energy-saving plans, but also on good energy management. By means of energy performance management, energy auditing, and key indicator comparison, we assist users in energy management, ensuring the sustainability of energy-saving achievements and truly achieving the goal of sustainable development.
4 Energy consumption analysis and expected effects
4.1 Comparative analysis of energy consumption
The energy management system has refined energy consumption analysis and management functions, which can provide single device energy consumption data for comparative analysis of energy consumption of similar devices, comparative analysis of energy consumption of the same device at different time periods, and multi-dimensional energy consumption data analysis, displaying the energy consumption situation, energy consumption structure, and year-on-year and month on month situation of each system.
4.2 Energy consumption management analysis
Energy management analysis provides various energy consumption data analysis tools such as energy consumption trend analysis, daily energy consumption trend analysis, and sub item energy consumption analysis. Through curves, it visually displays the peak, valley, and sub item energy consumption of each region every day, and finds the energy consumption differences in each region. Based on the historical energy consumption of the system and the calculation conditions set by the user, comprehensively analyze and predict the future energy usage.
4.3 Energy consumption analysis report and data display
The energy management system can also generate various energy consumption analysis reports, mainly including total energy consumption report, classified energy consumption report, sub item energy consumption report, year-on-year energy consumption report, month on month energy consumption report, energy plan report, energy plan and actual comparison report, and energy loss report. Detailed display of dynamic energy consumption data analysis, using intuitive graphical interfaces (bar charts, pie charts, line charts, etc.) to display and analyze energy consumption data, supporting free query functions on a daily, weekly, monthly, yearly, and customized basis. Statistical reports refer to various forms of energy consumption value reports, such as regional energy consumption statistical reports, energy consumption type statistical reports, daily statistical reports, monthly statistical reports, annual statistical reports, total building energy consumption statistical reports, unit area energy consumption reports, etc., which can help users grasp their own energy consumption situation, identify abnormal energy consumption values, and provide data support for energy consumption statistics and energy audits.
4.4 Energy saving analysis
(1) Lighting system. The main indicators that affect the energy consumption of lighting systems include the number of lamps turned on, lighting time, design illuminance, and standard illuminance values. The number of lighting fixtures to be turned on is related to the design of the lighting circuit, the lighting time is related to the control strategy, and the design illuminance and standard illuminance values are adjustment issues between actual use and design specifications. Reasonably selecting the switch time of lighting fixtures, balancing the regulation relationship between standard illumination and usage illumination, and designing lighting circuits reasonably are all key points for energy-saving lighting systems.
(2) Air conditioning system. The methods for achieving energy conservation in air conditioning systems are as follows:
① Based on the analysis of HVAC air supply areas, environmental temperature values are set for each zone to control the temperature in the waiting area. For less important areas, environmental control is achieved through air energy exchange to reduce fan operating speed and shorten fan operating time. ② Adjust the operating time of the air conditioning unit according to the seasonal temperature characteristics. ③ Adjust the air supply frequency and operating time of the variable frequency air conditioner according to the outdoor temperature.
(3) Estimation of energy-saving effect. The electricity bill for the airport terminal accounts for 36% of the energy cost, approximately 200 million yuan, with an energy consumption of 200 million kW · h, averaging 1.00 yuan/kW · h. By estimation, this project can save 19.616 million yuan in electricity bills annually, with good energy-saving effects.
5 Platform Design and Functionality
5.1 System Platform Design
The smart energy management platform adopts a decentralized distributed network architecture design as shown in Figure 2, using B/S mode to achieve cloud modeling, design and deployment, simplifying the maintenance work of clients and providing software support for the expansion of functional modules based on business models. To meet the requirements of storing and processing massive real-time data for the group, historical data stored in the system will not be deleted, and the system will not be affected by the increase in data volume affecting storage and access speed. Follow the system application plugin specifications for secondary development, and the developed functional module plugins can be seamlessly configured and used in the application interface.
5.2 System Implementation
Each factory implements the construction of a carbon management system, firstly by developing a carbon management architecture that meets management requirements, which can be flexibly adjusted according to changes in management needs. The carbon management architecture can be configured according to the factory area, workshop, and production line, and energy consumption data can be associated with the management architecture to demonstrate the scope and depth of energy management.
function
AcrelEMS Enterprise Microgrid Energy Efficiency Management System provides industry-specific energy efficiency management solutions, supporting wired/wireless solutions to access various smart devices and providing multiple third-party system interface protocols. It integrates enterprise microgrid power monitoring, energy consumption statistics, power quality analysis and governance, intelligent lighting control, monitoring of major energy consuming devices, charging pile operation management, distributed photovoltaic monitoring, energy storage management, and other functions. Through one platform, it can centrally monitor, dispatch, and operate the enterprise power grid as a whole, meeting the requirements of reliable, safe, energy-saving, and orderly electricity consumption for enterprises. The platform supports switching between Chinese and English, and has been applied to energy management and power operation and maintenance platforms in multiple industries and regions. A single platform has integrated data from over 1600 user substations, providing energy analysis and operation and maintenance management functions.
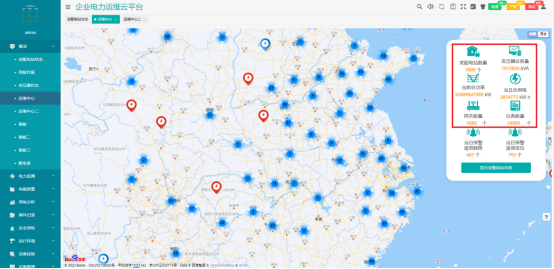
Figure 3AcrelEMS Energy Efficiency Management Platform Application
Power Monitoring
Real time monitoring and control of electrical parameters, operating status, and contact temperature of distribution related equipment such as transformers, circuit breakers, DC screens, busbars, reactive power compensation cabinets, and cables in the enterprise's high and low voltage power distribution system. Monitor the power quality of the main circuits of the enterprise's microgrid and carry out treatment. Timely handle faults and issue alarm messages to improve the reliability of enterprise power supply.
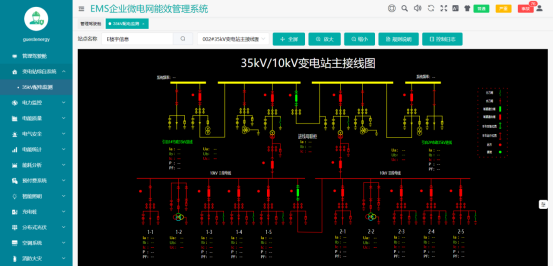
Figure 4 Power Monitoring Function
Energy Consumption Analysis
Collect energy consumption data such as electricity, water, and gas from enterprises, conduct classified and itemized energy consumption statistics, calculate energy consumption data and trends per unit area or product, diagnose energy efficiency of main energy consuming equipment, calculate enterprise carbon emissions, and provide data support for enterprises to formulate carbon peak and carbon neutrality routes.
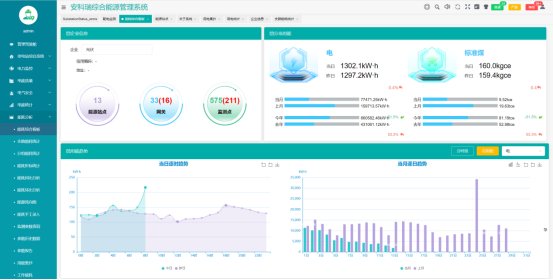
Figure 5 Energy consumption analysis function
lighting control
The intelligent lighting control function can achieve timed control, light sensing control, scene control, dimming control, etc. according to the enterprise situation, and combined with infrared sensors and ultrasonic sensors, it can realize the lighting on and off when people come and go, and can achieve centralized control according to the system's control strategy, saving lighting electricity for the enterprise.
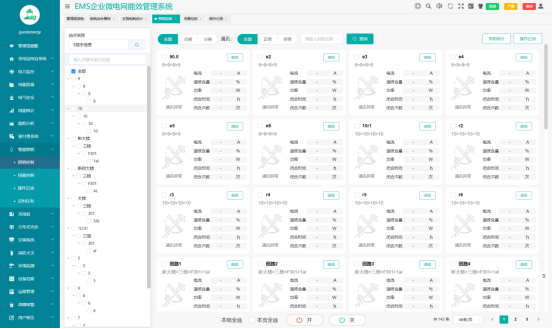
Figure 6 Lighting Control Function
Distributed photovoltaic monitoring
Monitor the operation of distributed photovoltaic power plants in enterprises, including inverter operation data, photovoltaic power generation efficiency analysis, power generation and revenue statistics, and photovoltaic power generation control.
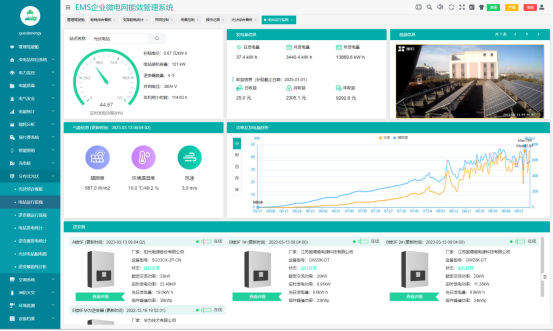
Figure 7 Distributed Photovoltaic Power Generation Monitoring
Energy storage management
Monitor the operation of energy storage systems, battery management systems (BMS), and energy storage inverters (PCS), including operating modes, power control modes, predetermined value information such as power, voltage, current, frequency, energy storage battery charging and discharging voltage, current, etc SOC、 Temperature, based on the peak and valley characteristics of the enterprise, fluctuations in electricity prices, and instructions from the higher-level platform, sets the charging and discharging strategy of the energy storage system, controls the charging and discharging of the energy storage system, achieves peak shaving and valley filling, and reduces the electricity cost of the enterprise.

Figure 8 Energy Storage Management
Operation and management of charging stations
Monitor the operation status of enterprise charging piles, provide charging pile fee management and status monitoring functions, and adjust the charging power of charging piles according to changes in enterprise load rate and scheduling instructions of virtual power plants, so as to ensure the stable and safe operation of enterprise microgrids.

Figure 9 Charging Station Management
Custom cockpit
Users can draw their own cockpit pages based on their focus points, including energy prepayment, charging station operation, energy consumption statistics, revenue statistics, and operation and maintenance status of various equipment such as elevators, air conditioning, and lighting.

Figure 10 Definition of Energy IoT Cockpit
Data collection and monitoring
Real time monitoring of power parameters such as voltage and current of each distribution cabinet, achieving telemetry, remote signaling, and remote control. Real time monitoring of environmental parameters such as room temperature and humidity, smoke detection, and water immersion in various power distribution systems. Monitor the operating status and energy consumption parameters of transformers, calculate losses, identify economic operating ranges, and reduce energy losses.

Figure 11 Data Collection and Monitoring
Energy consumption statistical analysis
Mainly responsible for statistical analysis of energy consumption data, energy consumption sub items, regional energy consumption, and energy consumption indicators. It also includes the constant energy consumption ratio, which refers to the percentage of actual energy consumption that occupies the total energy, and is represented using various graphical methods for comprehensive energy consumption analysis.

Figure 12 Energy consumption statistical analysis
Electrical and Fire Safety Management
Connect electrical fire detectors, wireless temperature sensors, intelligent circuit breakers and other equipment to monitor and manage real-time fire hazard parameters such as residual current and cable temperature in the distribution circuit. Install fire water level gauges in places such as fire water pools and fire water tanks to detect changes in fire water levels; Install fire water pressure gauges in areas such as fire pipes and sprinklers to detect the pressure of fire pipes. Install independent smoke detectors or combustible gas detectors in indoor areas such as homes, hotels, and apartments to detect the presence of smoke and combustible gases.

Figure 13 Electrical Fire Safety Management
Energy fee management
Suitable for property lessees to manage energy charges for leased properties, supporting integrated water and electricity charging management, with tenant account opening, closing, and refund operations, supporting time of use electricity price and tiered electricity price settings, and power overload threshold settings. It can be integrated with payment applications to achieve self-service payments.
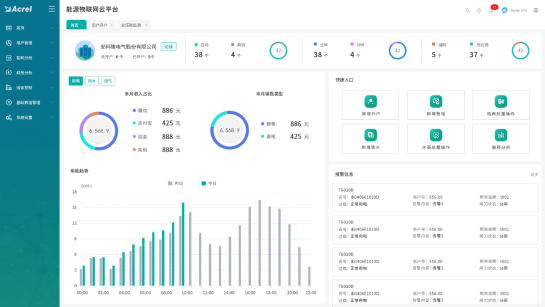
Figure 14 Energy consumption fee management
Operation and management of charging stations
When users need to manage multiple charging stations' charging stations, they can self connect the charging stations to the platform to monitor the status of the charging stations and manage charging fees by scanning codes and swiping cards. During peak electricity consumption periods, if the charging load exceeds the capacity of the power transformer, automatic charging power limits or new charging limits can be set, or new energy can be introduced to ensure energy supply security.
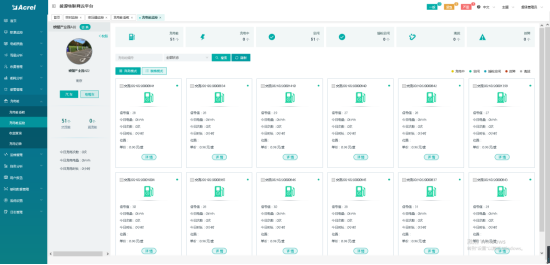
Figure 15 Operation and Management of Charging Stations
Lighting control management
The switch of lighting equipment can be remotely controlled, and the lighting can be automatically controlled according to the light intensity, latitude and longitude, sunrise and sunset time, and time setting strategy to save lighting energy.
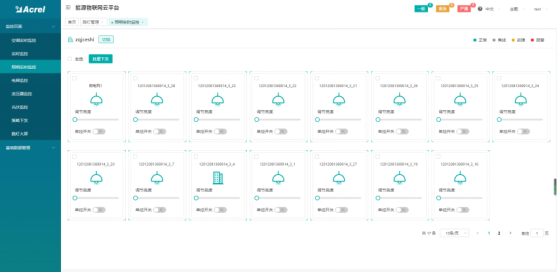
Figure 16 Lighting Control Management
carbon emission analysis
Count users' carbon emissions and track their carbon footprint, provide a carbon emissions inventory, and conduct quota accounting and assessment.
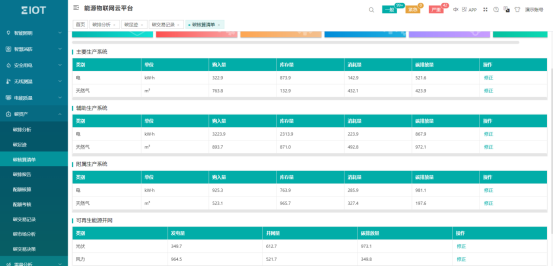
Figure 17 Carbon Emission Analysis
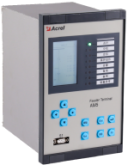
4.3 Hardware Equipment Composition
The intelligent energy management systems of different industrial and energy enterprises are usually connected in a ring network or star network structure, forming a hierarchical industrial ring network. The main station of the control center is responsible for controlling multiple subordinate sub stations. The specific sub station ring network structure of the energy management system is shown in Figure 2.
type |
model |
appearance |
Product features |
Medium and high voltage microcomputer protection device |
|
AM6、AM5SE |
Implement protection, measurement, and automatic control functions for 110kV to 10kV circuits |
Online monitoring device for power quality |
|
APView500 |
Real time monitoring of power quality such as voltage deviation, frequency deviation, three-phase voltage imbalance, voltage fluctuations and flicker, harmonics, etc., recording various power quality events, recording waveforms before and after events, assisting users in analyzing the causes of power quality occurrence, and locating disturbance sources. |
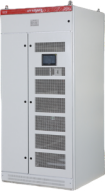
Dynamic harmonic reactive power compensation system |
|
AnCos*/*-G Ⅰ 型 |
At the same time, it has the functions of harmonic control, reactive power linear compensation, three-phase current balance control, and stable voltage. It has fast response time, high accuracy, and stable operation. It can automatically adjust the output according to the reactive power characteristics of the system and dynamically compensate for the power factor; |
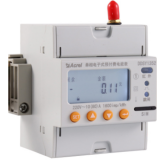
Metering electric energy meter |
|
DTSD1352 |
Equipped with full power measurement and energy statistics, it can be directly connected within 80A and installed on rails. |
Cost controlled energy meter |
|
DDSY1352-Z |
Measuring single-phase user current, voltage, and time-sharing energy, with multiple rate settings, suitable for 8 seasonal modes, 8 time period rates, and 14 time period settings. Equipped with a built-in disconnect switch, it can disconnect single-phase currents up to 60A and supports RF card swiping or remote recharging. |
Cost controlled energy meter |
|
DDSY1352-XDM |
Single phase prepaid energy meter, supporting 1 single-phase incoming line and 3-5 single-phase outgoing lines, used for independent control of lighting, sockets, air conditioning, bathrooms, etc., with malignant load recognition function. |
Cost controlled energy meter |
|
DTSY1352-Z |
Measuring the current, voltage, and time-sharing energy of a single three-phase user, with multiple rate settings, suitable for 8 seasonal modes, 8 time period rates, and 14 time period settings. Equipped with a built-in disconnect switch, it can disconnect three-phase currents up to 80A and support RF card swiping or remote recharging. |
|
expense control Multi-user table |
|
ADF400L-Y |
Up to 36 single-phase circuits or 12 three-phase circuits can be metered for energy billing, with time of use electricity pricing and multiple rate settings. The built-in disconnect switch can disconnect three-phase currents up to 80A. The number of modules can be assembled according to the number of users. |
Internet of Things Instruments |
|
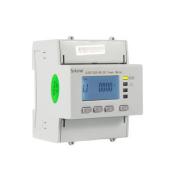
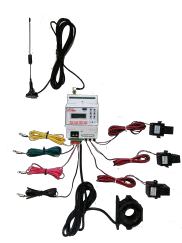
ADW300W |
Mainly used for measuring three-phase electrical parameters of medium and low voltage distribution, collecting state variables and controlling circuit breakers, it can be flexibly installed in distribution boxes, comes with an open type transformer, can be installed without power outage, has RS485, 4G, LoRaWan wireless communication functions, and is suitable for digital transformation of distribution systems. |
Single-phase electronic meter |
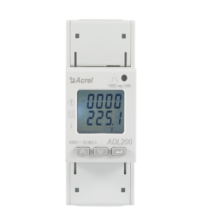
ADL200 |
|
Measurement of single-phase electrical parameters U, I, P, Q, S, PF, F. Total energy measurement (reverse to forward), with 3-month historical energy data frozen and stored; 8-bit segmented LCD display; Active power pulse output; The accuracy of active power is level 1, and the accuracy of reactive power is level 2. |
Three phase electronic meter |
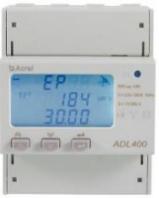
ADL400 |
|
Measurement of three-phase electrical parameters U, I, P, Q, S, PF, F. Measurement of active and reactive electrical energy in both forward and reverse directions; A. B and C phase forward active energy metering; 2-31st harmonic voltage and current; 12 bit segmented LCD display, backlit display, power accuracy of 0.5s level. |
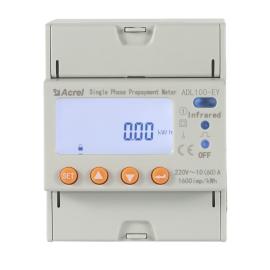
Single phase prepaid electricity meter |
DDSY-4G |
|
Measurement of single-phase electrical parameters U, I, P, Q, S, PF, F. Active energy metering (forward and reverse), A, B, C phase forward active energy, supports 4 time zones, 2 time period tables, 14 daily time periods, 4 maximum demand rates and occurrence times, real-time demand, historical frozen data purchase records; 8-bit segmented LCD display, backlit display; Active power pulse output; Active power accuracy level 1, reactive power accuracy level 0.5s. |
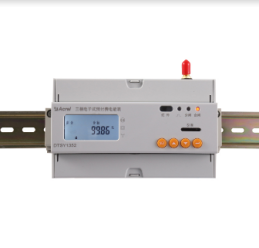
Three phase prepaid electricity meter |
DTSY-4G |
|
Measurement of three-phase electrical parameters U, I, P, Q, S, PF, F. Active energy metering (forward and reverse), A, B, C phase forward active energy, supports 4 time zones, 2 time period tables, 14 daily time periods, 4 maximum demand rates and occurrence times, real-time demand, historical frozen data purchase records; 8-bit segmented LCD display, backlit display; Active power pulse output; Active power accuracy level 1, reactive power accuracy level 0.5s. |
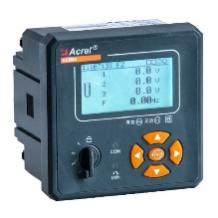
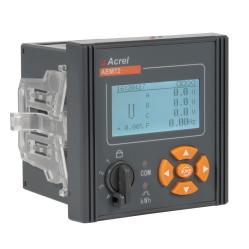
Multi functional power meter |
AEM96 |
|
Measurement of three-phase power parameters, phase angle of voltage and current, four quadrant energy metering, multiple rates, maximum demand, historical energy statistics, switch event recording, historical extreme value recording, analysis of 31st harmonic and total harmonic content, phase harmonic and fundamental electrical parameters (voltage, current, power), switch quantity, alarm output communication method: RS485 interface, supporting Modbus RTU protocol |
AEM72 |
|
Measurement of three-phase power parameters, phase angle of voltage and current, four quadrant energy metering, multiple rates, maximum demand, historical energy statistics, switch quantity event records, historical extreme value records, analysis of 31st harmonic and total harmonic content, phase harmonics and fundamental electrical parameters (voltage, current, power), switch quantity, alarm output Communication method: RS485 interface, supports Modbus RTU protocol |
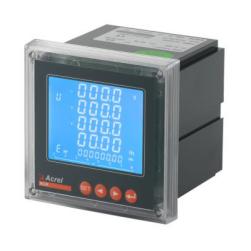
|
ACR series |
|
All three-phase power parameters, maximum demand record (ACR320EFL), time-sharing energy statistics and December energy statistics, date and time display, LCD display, RS485 communication, event recording. Communication methods: RS485, Prifibus DP, Ethernet |
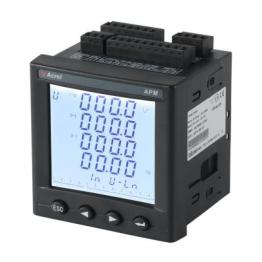
|
APM series |
|
Full power measurement, four quadrant energy, multi rate energy, internal temperature measurement of instruments, optional total active power, total reactive power, total apparent energy pulse output, second pulse, etc. Real time demand and maximum demand (including timestamp) for three-phase current, active power, reactive power, apparent power. The extreme values of current, line voltage, phase voltage, active power, reactive power, apparent power, power factor, frequency, total harmonic of current, and total harmonic of voltage for the current month and the previous month (including timestamps). In Chinese, the active energy is at the level of 0.2 seconds. Communication methods: RS485, Prifibus DP, Ethernet |
|
DC energy meter |
DJSF1352 |
|
1. Accuracy: Level 1 or Level 0.5, with ± 12V voltage output for Hall sensor power supply 2. Measurement: Voltage, current, power, forward and reverse electrical energy, supporting dual channel metering. |
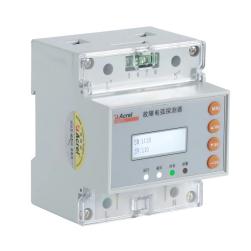
Smart electricity monitoring device |
ARCM300-Z |
|
Three phase (I, U, Kw, Kvar, Kwh, Kvar, Hz, cos Φ), apparent energy, four quadrant energy metering, single circuit residual current monitoring, 4-channel temperature monitoring, 2-channel relay output, 2 Road switch input, supporting power-off alarm upload |
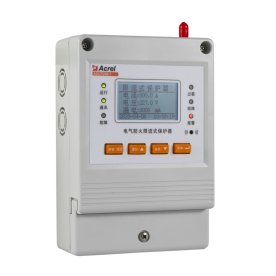
Electrical fire protection current limiting protector |
ASCP200-40B |
|
It can achieve functions such as short-circuit current limiting and arc extinguishing protection, overload current limiting protection, internal over temperature current limiting protection, overvoltage protection, leakage monitoring, cable temperature monitoring, etc. It has 1 RS485 communication channel and 1 GPRS (or NB) wireless communication channel. The rated current is 0-40A, and the rated current menu can be set |
Fault arc detector |
AAFD-DU |
|
Monitor fault arcs, leakage, and temperature Two passive dry contact (switch quantity) inputs Two passive normally open contacts (switch quantity) output |
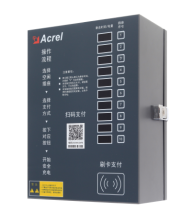
Electric scooter charging station |
ACX series |
|
Full of self stop, power-off memory, short circuit protection, overload protection, no-load protection, fault circuit identification, remote upgrade, power identification, independent metering, and alarm reporting. Supports coin insertion, card swiping, QR code scanning, and free charging, |
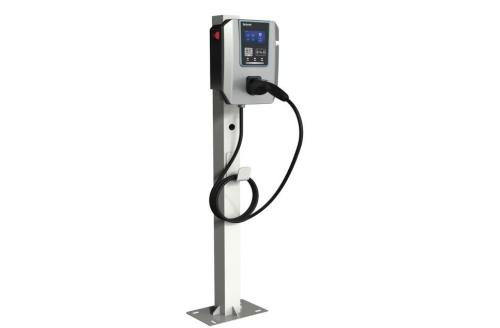
electric vehicle charging station |
AEV_AC007 |
|
Rated power of 7kW, single-phase three wire system, protection level IP65, equipped with lightning protection, overload protection, short circuit protection, leakage protection, intelligent monitoring, intelligent metering, remote upgrade, supporting card swiping, scanning, plug and play. Communication methods: 4G, Bluetooth Wifi 30KW, 600KW, 120KW available in multiple specifications |
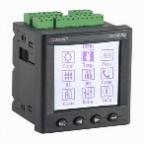
Electrical contact online temperature measurement device |
ARTM-Pn |
|
It can monitor voltage, current, frequency, active power, reactive power, and electrical energy, and can receive temperatures from 60 wireless temperature sensors |
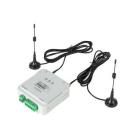
ATC600 |
|
The ATC600 has two working modes: terminal (- C) and relay (- Z), which can be configured according to the project layout. Can receive temperatures from 240 wireless temperature sensors |
|
Intelligent photovoltaic collection device |
AGF-M series |
|
Photovoltaic cell string open circuit alarm can be comprehensively judged in conjunction with string voltage; Equipped with 3-channel switch status monitoring, used to collect the output air contact status of DC circuit breakers, lightning arresters, etc; The current is connected through perforation, which is easy to install and has high safety; The measuring element adopts Hall sensors, which isolate and measure the maximum current of 20A; the voltage measurement function can measure the maximum DC 1500V of the bus voltage |
Three remote units |
ARTU series |
|
Expandable DIDO and multiple analog input/output units. Communication method: RS485 interface, Modbus protocol. Scalable 2G, Lora, LoRAWAN, NB IoT, 4G, Ethernet |
Smart Lighting |
ASL200 series |
|
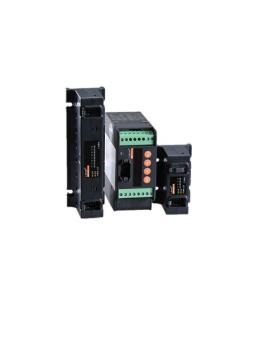
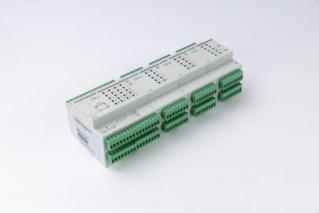
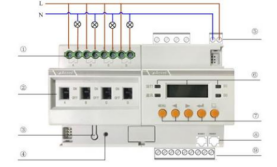
Remote control output Two passive dry contact (switch quantity) inputs Two passive normally open contacts (switch quantity) output |


5. Conclusion
This article combines a practical case of an airport's energy management improvement and renovation project to analyze and summarize the application of intelligent instruments in energy management improvement. By applying the technical solutions summarized in this article, good energy-saving effects can be achieved. At present, there are many terminals in China with similar needs, and it is hoped that this article can serve as a reference for related engineering designs.