-
E-mail
1591259053@qq.com
-
Phone
15666889209
-
Address
Room 207, Building 1, Weifang High tech Zone Optoelectronic Industry Accelerator (Phase I), No. 155 Optical Circuit, Weifang High tech Zone, Shandong Province
Download
Shandong Jingdao Optoelectronics Technology Co., Ltd
Monitoring road water accumulation station: visual data platform, presenting water accumulation situation intuitively
Date: 2025-12-22Read: 6
【JD-JSJC】, Shandong Jingdao Optoelectronics, customer-centric and quality-oriented, work together for a win-win future.
How to quickly and accurately understand the situation of road waterlogging in cities is the key to solving the problem. The visual data platform built by monitoring road waterlogging stations provides clear and understandable information for urban managers, transportation departments, and citizens to visually present the characteristics of waterlogging situations, playing an important role in urban waterlogging management and response work.
Visual data platform: an intuitive window for water accumulation information
Rich data display content
The visualization data platform integrates a large amount of data collected by various sensors from monitoring road waterlogging stations and presents it in an intuitive way. Firstly, the platform will display real-time water level information of road waterlogging. Through dynamic water level charts or intuitive water level indicators, users can clearly see the specific values and trends of water accumulation depth in different road sections. For example, mark the locations of each monitoring point on the map, and use bar charts of different colors or heights to represent the current depth of water accumulation. The darker the color or the higher the bar chart, the deeper the water accumulation, allowing users to easily identify which road sections have more severe water accumulation at a glance.
Rainfall data is also one of the important contents displayed on the platform. The platform will present the changes in rainfall over time in the form of charts, including cumulative rainfall, rainfall intensity, and other information. By observing these data, users can analyze the relationship between rainfall and waterlogging formation. For example, when rainfall increases sharply in a short period of time, combined with water level data, it is possible to determine which road sections may experience water accumulation due to inadequate drainage and prepare in advance.
In addition, the visualization data platform will also display the area range of accumulated water. Using Geographic Information System (GIS) technology, the flooded area is clearly delineated on the map and updated in real-time. This enables urban managers to have a clear understanding of the impact of waterlogging on surrounding areas, such as whether it affects important transportation hubs, residential areas, etc., providing intuitive basis for decision-making. At the same time, the platform may also display information such as the direction and speed of water accumulation, helping relevant departments better grasp the dynamics of water accumulation.
Diversified forms of data display
In order to meet the needs of different users, the visualization data platform adopts diverse forms of data display. For urban managers and professionals, the platform provides detailed data reports and analysis charts. These reports and charts can be used for comparative analysis of historical waterlogging data, such as waterlogging situations in different years and seasons, to identify the patterns and trends of waterlogging occurrence. At the same time, data mining and analysis tools can be used to deeply study the relationship between water accumulation and other factors (such as terrain, drainage systems, etc.), providing scientific basis for the optimization of urban drainage systems.
For ordinary citizens, the platform displays water accumulation information in a concise and easy to understand manner. Through the visual interface of mobile apps or web pages, citizens can intuitively see the distribution of road waterlogging. On the map, flooded sections are marked in prominent colors, and clicking on the mark allows you to view information such as the depth of the flooded area and the estimated time for resuming traffic. In addition, the platform will also provide voice broadcast or SMS reminder functions. When there is water accumulation on the road section that citizens are concerned about, they will be notified in a timely manner, making it convenient for citizens to plan their travel routes and avoid water accumulation areas.
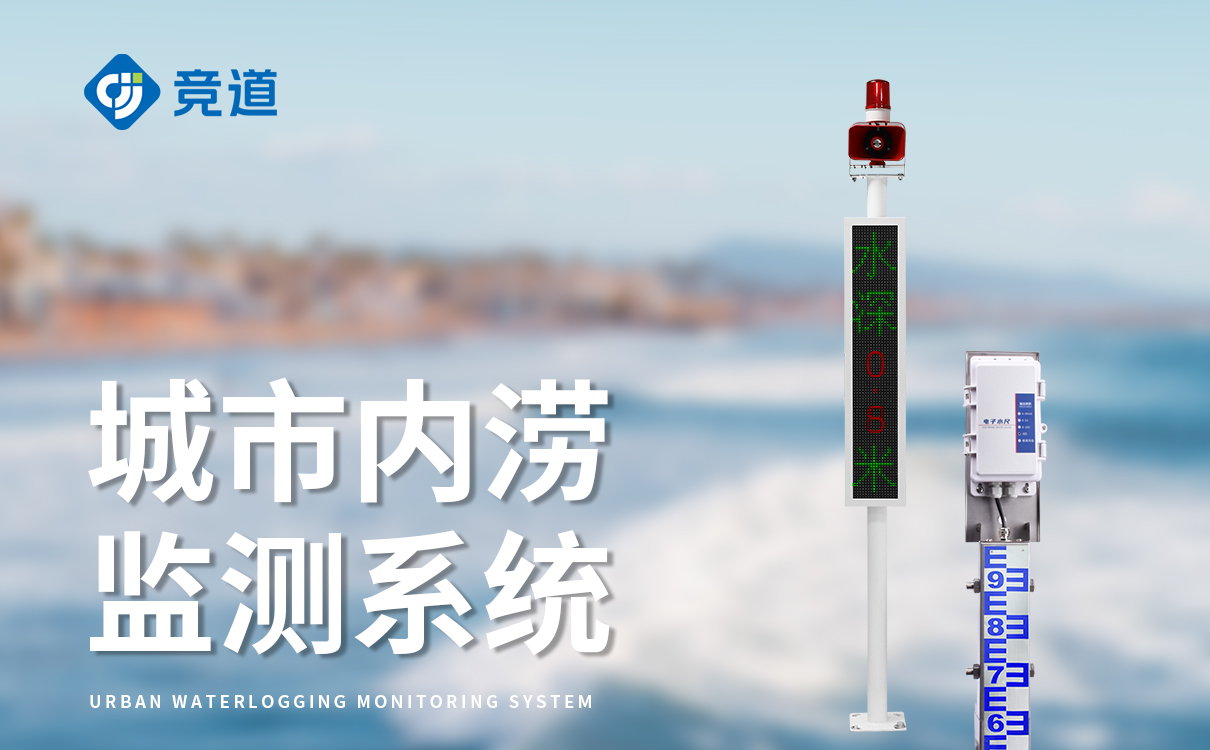
Visual presentation of water accumulation situation: helping all parties to respond efficiently
Provide intuitive basis for urban management decision-making
The visual data platform presents the water accumulation situation intuitively, providing strong support for urban management decision-making. City managers can use the platform to real-time understand the overall situation of road waterlogging in the city, including the distribution, severity, and development trends of waterlogging. For example, when there is a large area of water accumulation, managers can quickly determine which areas need priority allocation of resources for drainage operations and which road sections need to strengthen traffic control based on the information displayed on the platform.
Meanwhile, through visual analysis of historical waterlogging data, urban managers can identify weak links in the city's drainage system. For example, in certain areas where water accumulation frequently occurs and the depth and duration of the water accumulation are relatively long, managers can identify the problem by analyzing visual data, combining terrain and drainage network layout information, and carry out targeted renovation and upgrading of the drainage system to fundamentally solve the problem of road water accumulation and improve the city's ability to cope with water accumulation.
Assist the transportation department in optimizing traffic diversion
For the transportation department, the visualization data platform presents the water accumulation situation as an important basis for optimizing traffic diversion. The traffic control department can adjust traffic control measures in a timely manner based on the location, scope, and severity of water accumulation displayed on the platform. For example, setting up no entry signs on heavily flooded roads, guiding vehicles to detour, and releasing real-time traffic information to citizens through channels such as traffic broadcasts and electronic displays.
In addition, the visualization data platform can also help the transportation department plan emergency transportation plans in advance. By analyzing historical water accumulation data and real-time water accumulation situation, the transportation department can predict the possible impact range and traffic flow changes of water accumulation, and formulate corresponding traffic diversion plans in advance. In the event of water accumulation, quickly organize and implement according to the plan to ensure orderly traffic, reduce the impact of water accumulation on traffic, and ensure the safety and smoothness of citizens' travel.
Convenient for citizens to plan their travel
The visual data platform provides citizens with a convenient channel to obtain water accumulation information and facilitates their travel planning. Before traveling, citizens can view the water accumulation information on the visual data platform through mobile apps or web platforms to understand the water accumulation situation at their destination and along the roads. In case of waterlogged roads, citizens can adjust their travel routes in advance and choose to avoid waterlogged areas to avoid traffic congestion and vehicle damage caused by waterlogged roads.
At the same time, the platform provides real-time updates on water accumulation information, allowing citizens to stay informed of the dynamic changes in road water accumulation during their travels. If there is water accumulation on the originally smooth road section, citizens can change their route in a timely manner to ensure smooth travel. This convenient way of obtaining information improves the autonomy and safety of citizens' travel, and reduces the impact of road waterlogging on their daily lives.
The visual data platform for monitoring road waterlogging stations presents the waterlogging situation intuitively through rich data display content and diverse data display forms, providing important support for urban management decision-making, traffic diversion by transportation departments, and citizen travel planning. It plays an indispensable role in urban response to road waterlogging problems, helping to improve the overall operational efficiency of the city and the quality of life of residents.