-
E-mail
744107632@qq.com
-
Phone
13105716565
-
Address
Room 505, Building 1, No. 2 Baiyang Street, Qiantang District, Hangzhou City
Product Categories
- Intelligent video monitoring device
- Multi purpose intelligent monitoring all-in-one machine
- Online monitoring of wind farm transformer box
- Integrated monitoring system for transmission lines
- Fault precise positioning system
- Partial discharge online monitoring device
- Grounding circulation online monitoring device
- Online monitoring system for lightning arresters in transmission lines
- Online monitoring system for insulator pollution level
- Voltage Transformer Online Monitoring Device
Hangzhou Dunheng Technology Co., Ltd

Online monitoring system for insulator pollution level
NegotiableUpdate on 11/20
- Model
- Nature of the Manufacturer
- Producers
- Product Category
- Place of Origin
Overview
The online monitoring system for insulator pollution level achieves real-time online monitoring, warning, analysis and decision-making of insulator pollution situation by installing insulator pollution monitoring instruments on insulator strings.
Product Details
Online monitoring system for insulator pollution level
1.1 Overview
The online monitoring system for insulator pollution in transmission lines can provide real-time monitoring of insulator pollution and micro meteorological conditions at monitoring points in high-voltage operating environments. The system transmits data information to the analysis and processing center through GSM/SMS or GPRS. Through expert analysis of various parameters, the system obtains equivalent salt density and pollution development trends based on leakage current values, discharge pulse numbers, and meteorological parameters, and timely understands the safety and reliability of operating insulators. Timely provide various warning and alarm methods for excessive insulators, guide maintenance and cleaning.
The system can not only reduce the probability of accidents such as insulator flashover and tripping to a certain extent, but also provide a query of leakage current values of lines, towers, insulators, etc. during a certain period of time. At the same time, it can also calculate the maximum leakage current, average leakage current, and the maximum leakage current and average leakage current of each phase; Maximum salt density value, average salt density value, and maximum salt density value and average salt density value of each phase. Moreover, it can provide theoretical basis for summarizing the decline law of insulator electrical performance, the relationship between insulator flashover and its micro meteorological and micro environmental changes, and valuable on-site operation data for the line operation and maintenance department to gradually realize the transition from "regular maintenance" to "status maintenance".
1.2 Significance
Due to the extremely uneven distribution of coal and hydropower resources in China, energy is mainly transmitted through the power grid. As an important component of the power grid, the operation safety and reliability of transmission lines are increasingly valued by power system operators and managers. Improving the automation and informatization level of transmission line operation and maintenance management has significant social significance and economic benefits.
2.1 Monitoring method:By installing insulator pollution monitoring devices on insulator strings, real-time online monitoring, warning, and analysis decision-making of insulator pollution can be achieved.
2.2 Monitoring content:Leakage current of insulators (using insulator pollution monitoring instrument).
2.3 Communication method:The insulator pollution monitoring instrument uses GSM/SMS/4G/CDMA communication to transmit data.
2.4 Power supply mode:The insulator pollution monitoring device is powered by solar energy, and the power supply includes solar cell modules, batteries, and charge and discharge controllers. The power supply time of the battery without sunlight is more than 30 days, and the service life of the battery is more than 5 years.
2.5 Operation mode:The system can adopt automatic or controlled collection methods.
2.6 Installation principles of monitoring devices:The selected installation location and the appearance structure of the device should not affect the normal maintenance work of the transmission line. The installation of the device should be neat and firm, and in principle, there should be a fixed point for the cable at least every 0.5 meters.
2.7 Installation location:Simply clamp the open-ended drainage device onto the surface of the insulator.
3.1 System Structure:The entire system consists of an insulator pollution monitoring device and a backend comprehensive analysis software system. The system structure diagram is shown in the following figure:

Online monitoring system for insulator pollution level
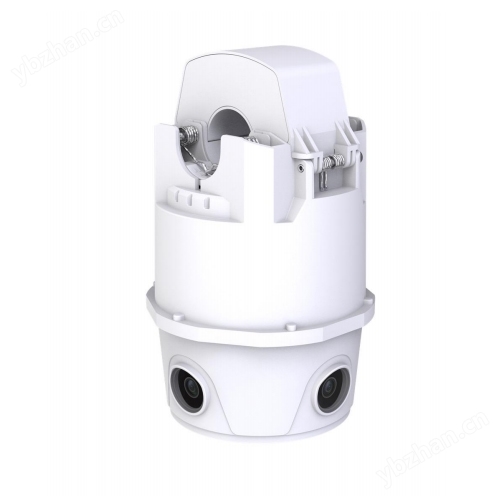
Insulator Pollution Monitoring Instrument
The insulator pollution monitoring device is installed on the insulator and has a long-distance wireless communication interface for data communication with the comprehensive analysis software system. The monitoring device can self check, collect, measure, and transmit the measurement results to the comprehensive analysis software system.
Backend analysis software system
The comprehensive analysis software system consists of a data communication module, a data processing server, a client, an uninterruptible power supply, and comprehensive analysis software.
The comprehensive analysis software can uniformly receive data from insulator pollution monitoring instruments, display, analyze and manage it uniformly, query and summarize historical data, generate reports, and make decision support analysis.
The system can interface with other MIS systems and share data.
3.2 Composition and Operating Environment of Monitoring System
Hardware configuration of monitoring device
(1) Leakage current collection sensors: three sets;
(2) Data conversion module: three sets;
(3) Power system: solar panels, charging controller, lithium battery;
(4) Substation communication system: 4G wireless data transmission module and IoT network card;
(5) 304 stainless steel host box;
(6) Front end equipment data communication connection cables, connectors, and shielding
(7) Front end equipment is equipped with fixed fixtures for installation;
runtime environment
Environmental temperature: -25 ℃~+45 ℃;
Working temperature: -40 ℃~+85 ℃;
Relative humidity: 5% RH~100% RH;
Atmospheric pressure: 550hPa~1060hPa;
3.3 System Software
Hardware configuration:Server (host capable of storing monitoring data for more than 10 years), data communication module, client, uninterruptible power supply;
Software configuration:Server operating system Windows Server 2008; Database management system SQL Server 2008; Client operating systems such as Windows XP/Windows 2008, IE browser; Comprehensive analysis software;
3.4 Backend Data Center
The backend system consists of a server and system diagnostic software. The server can be set up in our company or the customer's cable inspection management center according to customer requirements. The system receives fault signals collected by the front-end monitoring terminal, analyzes them through pollution level software, and obtains the diagnosis result of pollution level. Local and remote access can be achieved by logging into the published web address. After the system diagnosis is completed, it will send fault alarm information to the preset operation and maintenance personnel's mobile phones, thus realizing the function of real-time online fault monitoring and positioning.
3.5 User Access
The user access interface adopts a B/S structure design. Remote login and access to the system can be achieved through the permission account and password assigned by the backend system. You can view the leakage current of insulator pollution and monitor the real-time working condition information of the equipment. Query real-time and historical fault information to access the system anytime, anywhere.
4. Main technical parameters
Scope of application: Online status monitoring of ceramic, glass, and composite insulators operating in 66KV to 500KV transmission lines.
Online status monitoring of ceramic, glass, and composite insulators operating in 66KV to 500KV substations.
Salt density measurement range: 0mg/cm2 to 1.0 mg/cm2
Measurement range of ash density: 0mg/cm2 to 2.0 mg/cm2
Temperature measurement range: -40 ℃ to+120 ℃, measurement accuracy: 0.5 ℃;
Humidity measurement range: 0-100% RH, measurement accuracy: 2% RH;
Wind speed measurement range: 0-75m/s, accuracy: ± (0.5+0.03 V) m/s;
Wind direction measurement range: 0-360 °, accuracy: ± 5 °;
Monitoring unit operating environment temperature: -40 ℃ to+85 ℃;
Monitoring unit operating environment humidity: not exceeding 98% RH;
Low power consumption: The entire machine consumes 3mA of power;
Communication method: GSM/GPRS/CDMA wireless communication;;
Monitoring host power supply: solar energy+battery;
The monitoring host can run continuously for more than 30 days without sunlight;
◆ Protection level: IP65;
◆ Battery service life: more than 5 years;
◆ Service life of solar panels: over 10 years;
Software system: free upgrade;
5.1 Characteristics of Monitoring Devices
(1) The device directly draws water from the surface of the insulator, and the signal is introduced through a shielded wire to improve the system's anti-interference ability, prevent electromagnetic, waterproof, and lightning strikes, ensuring stable and reliable signal transmission and system operation;
(2) High measurement accuracy. This system device can collect ultra-low weak signals with a measurement accuracy of 0.01 milliamps, and can collect weak current signals between 50~20000Hz, successfully solving the problem of collecting ultra-low weak signals in strong electric field environments.
(3) Equipped with data collection, measurement, and communication functions, the measurement results are transmitted to the backend comprehensive analysis software system through a communication network;
(4) Power on self starting function;
(5) Equipped with online self diagnostic function;
(6) Time synchronization function, capable of receiving timing commands from comprehensive analysis software systems, timing once a day with an error of no more than 5 seconds;
(7) Installation is very convenient, just clip the open drainage device onto the surface of the insulator. It can be installed without power outage and does not affect the normal operation of the line.
(8) Having appropriate interfaces for local debugging;
(9) The data temporary storage function can store data for more than 3 days in case of communication abnormalities;
(10) The device host adopts a solar energy+battery power supply mode, and the tower tilt angle acquisition unit adopts a solar energy+lithium battery power supply mode. Under continuous rainy and cloudy conditions, the device host can work normally for at least 30 days, and the tower tilt angle acquisition unit can work normally for at least 1 year;
5.2 Characteristics of Comprehensive Analysis Software System
(1) Capable of automatically receiving data from the data collection unit at regular intervals;
(2) It has the function of remotely setting the collection method (self-control or controlled mode) and automatic collection time;
(3) The backend software can set the data collection density according to user needs;
(4) Can send timing commands to the data collection unit;
(5) Can remotely modify the IP address and port number of the data collection unit;
(6) Capable of querying and analyzing historical data, and automatically generating reports;
(7) Equipped with alarm prompt function;
(8) Can interface with other MIS systems;
(9) Free upgrade available;
(10) Trend analysis can be conducted based on historical and current data, and trend charts can be created to infer the development speed and trend of pollution accumulation, and to determine the periodic variation of AC arc along the polluted insulation surface, providing an effective means for early prediction of flashover occurrence;
(11) On the trend chart, up to 6 channels' parameters can be displayed simultaneously, which means that the parameters of six insulator strings on a tower can be displayed in different colors.
Similar Product Recommend