-
E-mail
376786168@qq.com
-
Phone
18971653633
-
Address
13th Floor, Zhongjian Guanggu Star Mansion, No. 799 Gaoxin Avenue, Donghu High tech Zone, Wuhan City, Hubei Province
Wuhan Shuntong Intelligent Technology Co., Ltd
Shuntong Cloud Equipment Diagnosis: Health Analysis of Air Compressors
Date: 2025-08-20Read: 8
1、 Analysis of Physical Characteristics of Air Compressor
1. Analysis of core functions of air compressor
As a key power equipment in industrial production, the core function of air compressors is to convert electrical or mechanical energy into gas pressure energy, providing a stable and clean compressed air source for various pneumatic systems. This device is widely used in automation control systems, pneumatic actuator drives, and process gas scenarios.
During the operation of an air compressor, a series of typical loss phenomena may occur due to mechanical wear, thermal stress changes, and medium pollution, including:
◆Lubricating oil oxidation aging leads to a decrease in lubrication performance
◆Air filter blockage causes increased intake resistance
◆Dust accumulation in the cooler leads to a decrease in heat transfer efficiency
◆Fatigue wear of valve plates causes deterioration of sealing performance
◆Bearing wear leads to a decrease in mechanical efficiency
These losses directly affect the efficiency of equipment operation and the quality of gas supply. Research has shown that the main failure modes of air compressors include bearing wear, valve fatigue fracture, increased rotor clearance, and motor insulation aging. These failure modes not only reduce equipment energy efficiency, but also may cause unplanned shutdowns, thereby affecting the stability and safety of the entire production line.
Therefore, building a health status assessment model based on physical characteristics can help achieve the transformation of air compressors from passive maintenance to predictive maintenance, and improve the overall lifecycle management level of equipment.
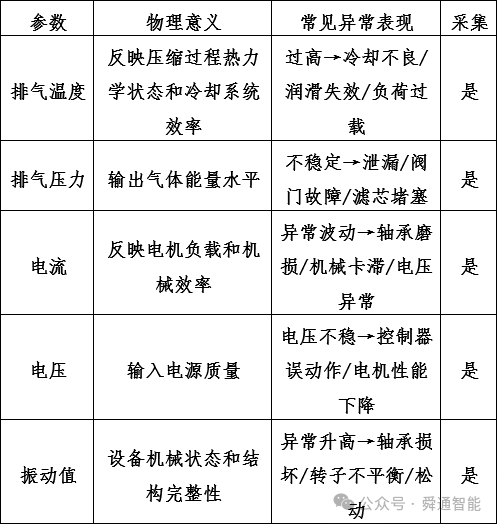
2. Key operating parameters of air compressor
2、 Definition of Health Status
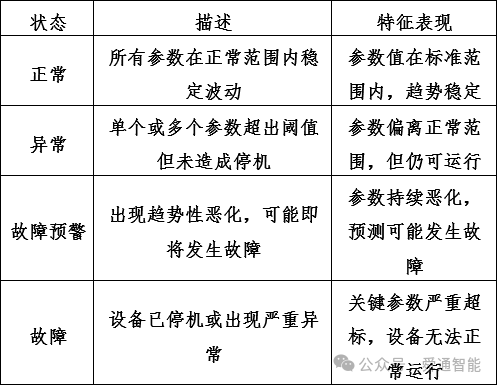
Based on the operating status of the equipment and historical maintenance records, the health status of the air compressor is classified into the following levels:
3、 Data model construction
1. Physical driven feature construction
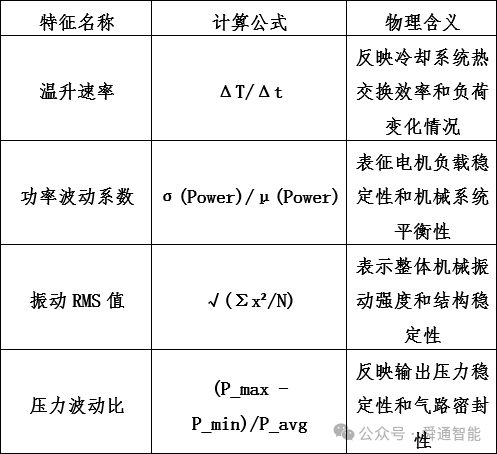
Based on the operating mechanism of the air compressor, the following key characteristic indicators are constructed:
2. Design of anomaly detection model
Adopting the Isolation Forest algorithm for anomaly detection. This algorithm is an unsupervised anomaly detection method based on tree structure. Its core principle is to recursively randomly select features and segment the sample space, making it easier to isolate outliers due to their distance from most data distributions.
2.1 Algorithm advantages
◆Has good processing ability for high-dimensional data
◆No need to label data, suitable for industrial sites
◆Low computational complexity, suitable for real-time detection
◆Has high sensitivity to detecting outliers
2.2 Algorithm Principles
Isolation forest achieves data point isolation by constructing multiple isolation trees (iTrees). Each isolated tree follows the following process:
◆Randomly select a feature dimension
◆Randomly select segmentation points between the maximum and minimum values of the feature
◆Repeating the above process recursively until all data points are isolated
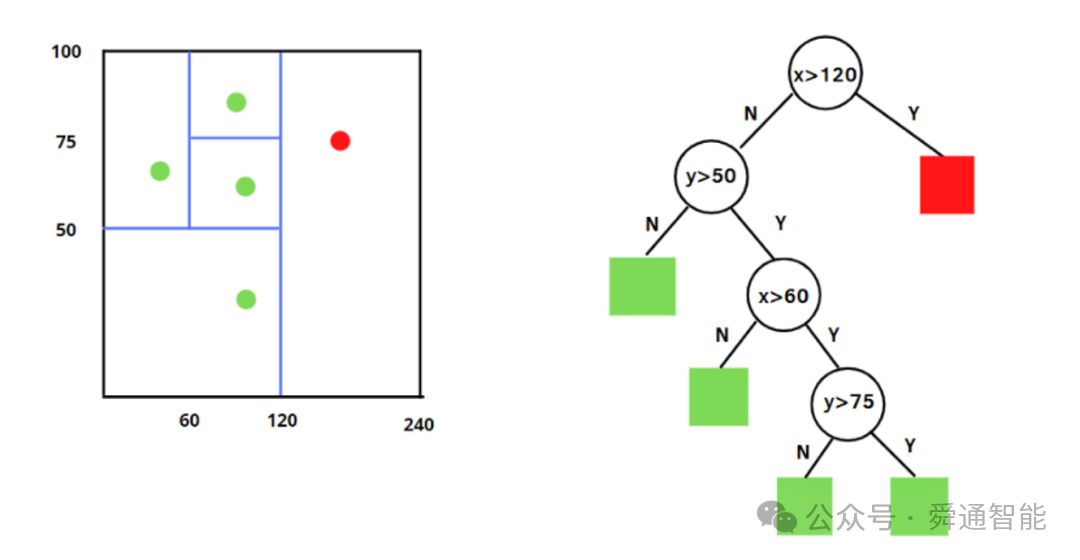
Figure 1: Isolation Forest Algorithm Example 1
Normal data points require more segmentation steps to be isolated, while outliers, due to their sparsity, are often isolated in fewer steps.
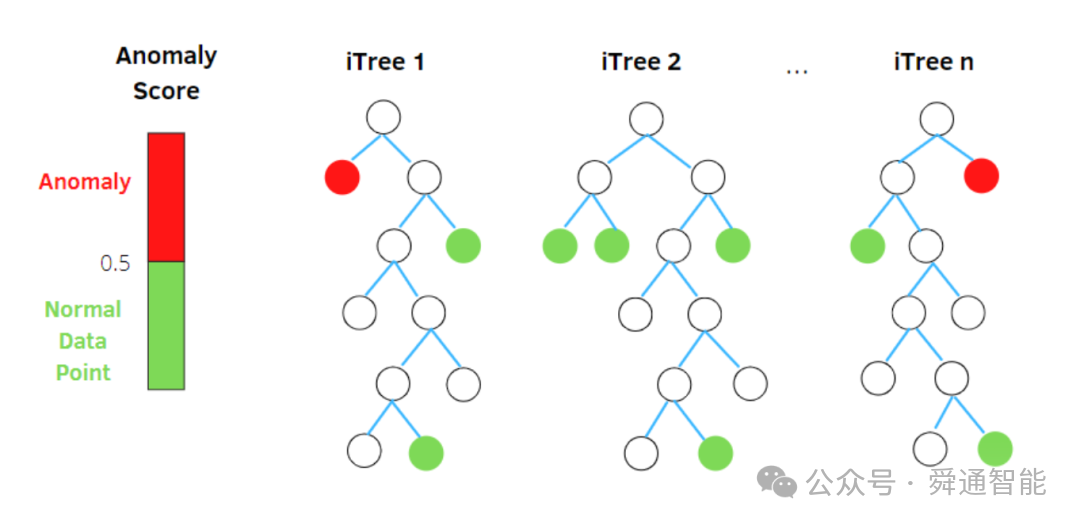
Figure 2: Isolation Forest Algorithm Example 2
2.3 Model Application Process
◆Data preprocessing: Standardization processing to eliminate dimensional influence
◆Feature selection: Select key physical parameters as input features
◆Model training: Training an isolated forest model based on historical normal data
◆Anomaly detection: Calculate the anomaly score for new data points
◆Threshold setting: Set abnormal judgment thresholds based on business requirements
3. Health monitoring and warning strategies
Establish a multi-level health rating system to quantify the health status of devices as a numerical value between 0-1:
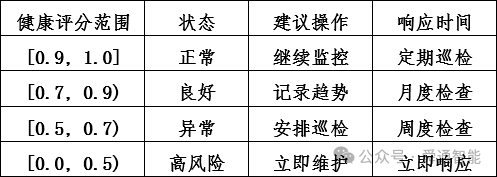
4、 System Integration Solution
The system provides health diagnosis results and diagnostic reports, and uses visualization to display health trends. Users can select a time range, site, and device for querying, and obtain the following visual results:
1. Functional modules
◆Data query module: supports querying historical data by dimensions such as time, site, device, etc
◆Health assessment module: real-time calculation of device health scores
◆Abnormal detection module: Identify abnormal device operation
◆Alert push module: timely sending alert information
◆Report generation module: Automatically generate diagnostic reports
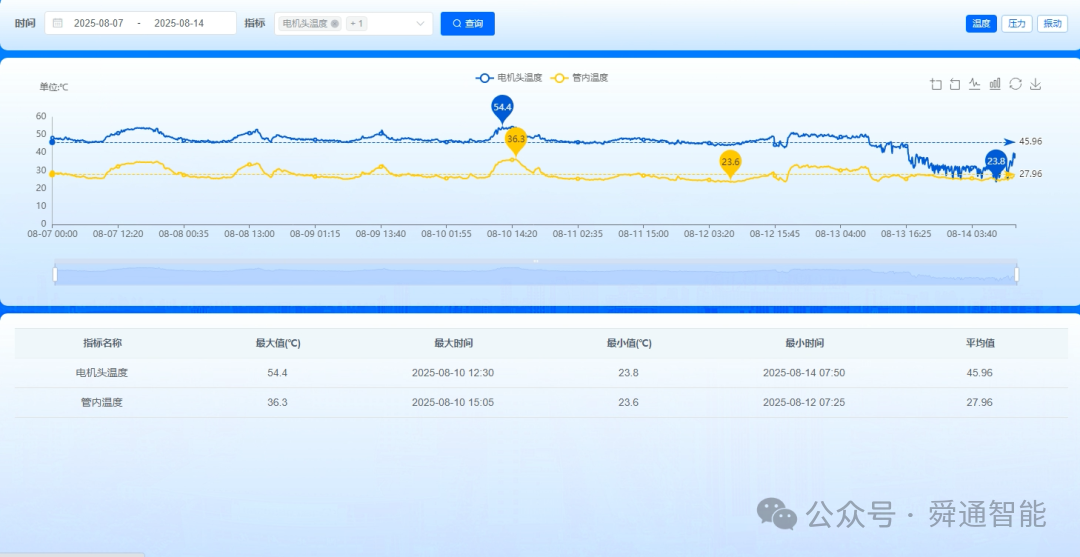
Figure 3: Real time operation data of equipment
2. Visual display
◆Health score trend curve
◆Real time monitoring chart of key parameters
◆Timeline of abnormal events
◆Distribution diagram of equipment health status
◆Maintenance suggestion prompt panel
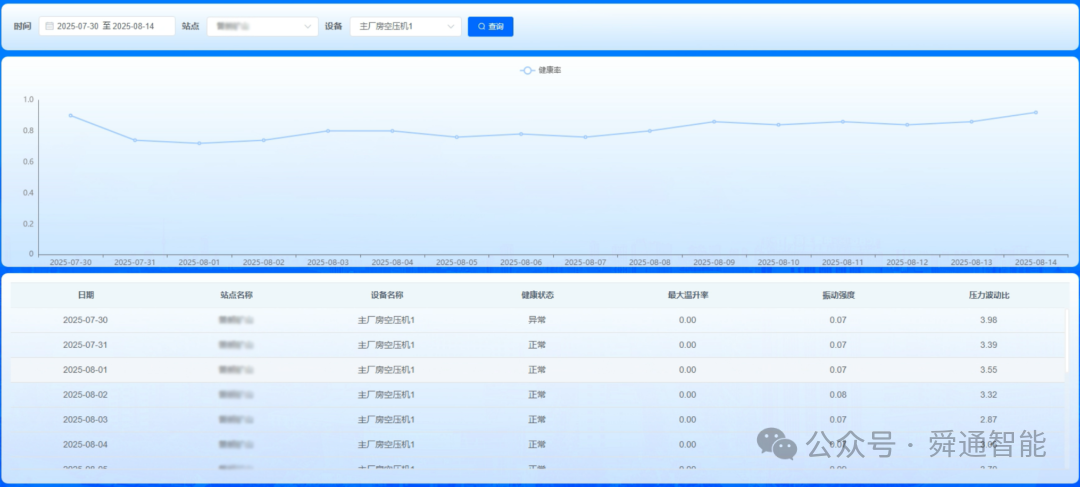
Figure 4: Equipment Health Diagnosis Results

Figure 5: Equipment abnormality alarm record
3. System advantages
◆Scientificity: a combination of physical characteristics and data-driven methods
◆Real time performance: supports real-time data processing and anomaly detection
◆Interpretability: Provide clear diagnostic criteria and maintenance recommendations
◆Scalability: Modular design facilitates functional expansion and system integration
Through the implementation of this plan, predictive maintenance of air compressor equipment can be achieved, reducing the risk of unplanned downtime, improving equipment operating efficiency, extending equipment service life, and providing strong support for the stable operation of industrial production.