-
E-mail
376786168@qq.com
-
Phone
18971653633
-
Address
13th Floor, Zhongjian Guanggu Star Mansion, No. 799 Gaoxin Avenue, Donghu High tech Zone, Wuhan City, Hubei Province
Wuhan Shuntong Intelligent Technology Co., Ltd
Shuntong Cloud Helps Zero Carbon Park Case Study Share
Date: 2025-09-25Read: 7
1、 Construction background
Against the backdrop of the "dual carbon" goal and accelerated energy transformation, energy custody, as an innovative energy service model, is gradually becoming an important choice for enterprises to reduce costs and increase efficiency, and for governments to promote energy-saving transformation. Unlike traditional energy equipment buying and selling or simple operation and maintenance, energy custody is based on "contract energy management" and achieves energy utilization and cost reduction through specialized full process services. Its core logic is "professionals do professional things", allowing energy users to focus on core business, and the custodian creates value through technology and management.
IIProject Introduction
Investment Promotion HighXinwang Valley is located inWuhan Donghu New Technology Development ZoneThe core area of Guanggu is adjacent to the intersection of Guanggu Avenue and Gaoxin Sixth Road, with a favorable geographical location. It is an important hub connecting Wuhan city and Donghu High tech Zone.
Covering an area of approximately 120000 square meters, the planned total construction area exceeds 300000 square meters, including multiple Grade A office buildings, scientific research incubation buildings, commercial supporting areas, and ecological green belts.
Building configuration: The project adopts a modern architectural style, with the main building height ranging from tens of meters to hundreds of meters. Each office building is equipped with high-speed elevators, intelligent security systems, and intelligent office systems to ensure an efficient and convenient office experience. The floor design is flexible and can meet the office needs of enterprises of different sizes, from small startups to large corporate groups, suitable office spaces can be found.
Parking spaces, the project plans to have over 2000 parking spaces and adopts an intelligent parking management system to effectively alleviate urban parking difficulties and provide convenient parking services for settled enterprises and visitors.
Greening rate, emphasizing ecological balance, with a greening rate of up to 30% in the park. The green landscape belt interspersed between office buildings not only beautifies the environment, but also provides comfortable rest space for employees, promoting physical and mental health.
3、 Current situation analysis
The lighting in public areas of the park, landscape lighting, etc., often remains on when the lighting conditions are good, leading to the prominent phenomenon of "long on lights". The lighting is controlled by traditional humans and cannot achieve the scene effect of lights turning off when people walk and lights on when people come.
The air conditioner cannot achieve temperature control and on/off time period control. The air conditioner temperature is set too low and cannot automatically shut down. Forgetting or missing to turn off the air conditioner often occurs, and it cannot be managed remotely.
The energy and water consumption scenarios in office buildings are complex, and there is a lack of effective management, control, and supervision measures, making it impossible to identify malicious loads and provide alerts for abnormal circuit electricity usage. And it still relies on traditional manual methods to collect energy consumption data, which is time-consuming, laborious, and prone to recording errors, omissions, and other situations.
High cost of manual management: manual inspection has a large workload and low efficiency;
Extensive management of energy systems: low level of intelligence, extensive management, and serious lack of refinement, resulting in serious waste of air conditioning systems.
System security is not guaranteed: When a fault occurs, it affects the normal operation of the building and poses mechanical and electrical safety risks.
This project aims to achieve energy conservation and efficiency improvement by adding a central air conditioning multi split controller, adding smart meters to the distribution room, adding microwave induction sensors and control modules to the lighting section, and wirelessly uploading them to the cloud platform through a communication management machine. Through the collaborative deployment of "hardware upgrade+software intelligent control".
4、 Systemarchitecture

①Display layer: mainly displays data in the energy system.
②Application layer: Classify, organize, statistically analyze, and monitor various energy data.
③Service layer: It only applies to the calculation, notification, classification, and control of data.
④Network layer: The underlying data is transmitted to servers through local area networks and the Internet of Things.
⑤Equipment layer: Install collection devices to monitor and control various systems.
5Equipment installation
照明部分
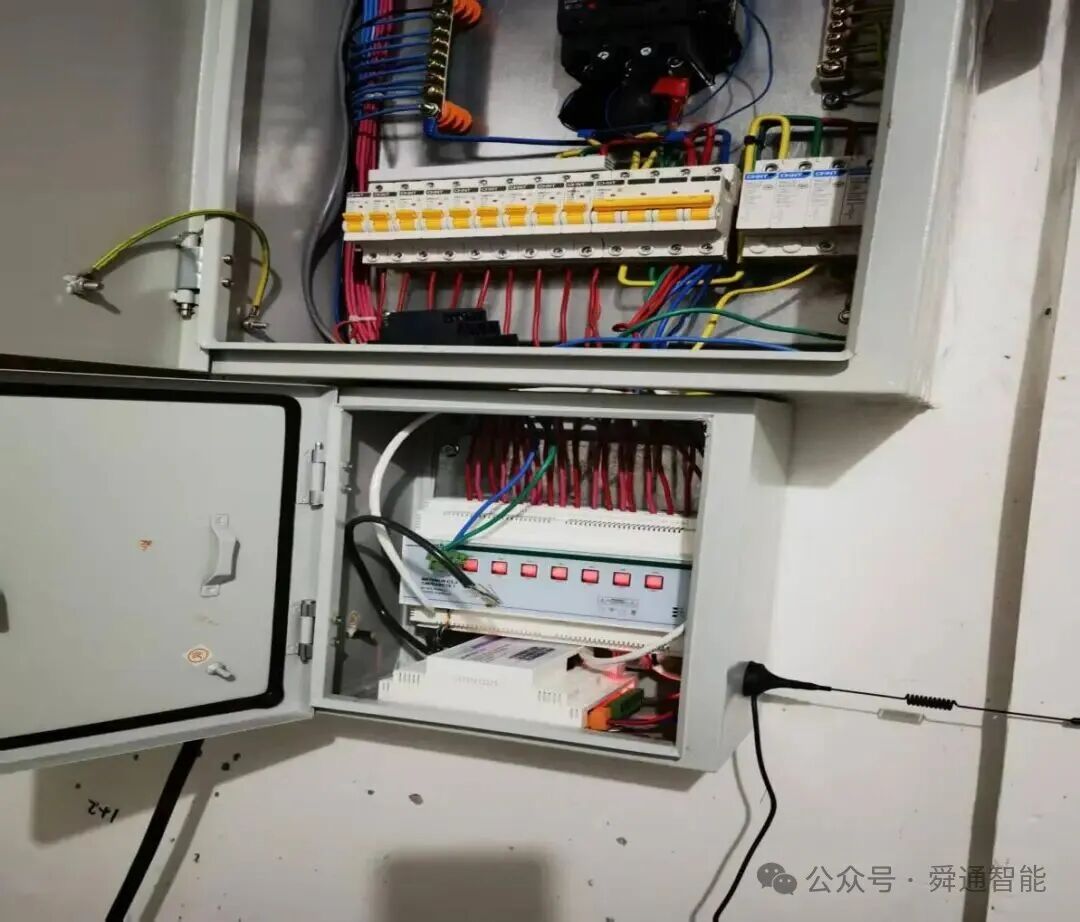
Lamp control module+intelligent gateway
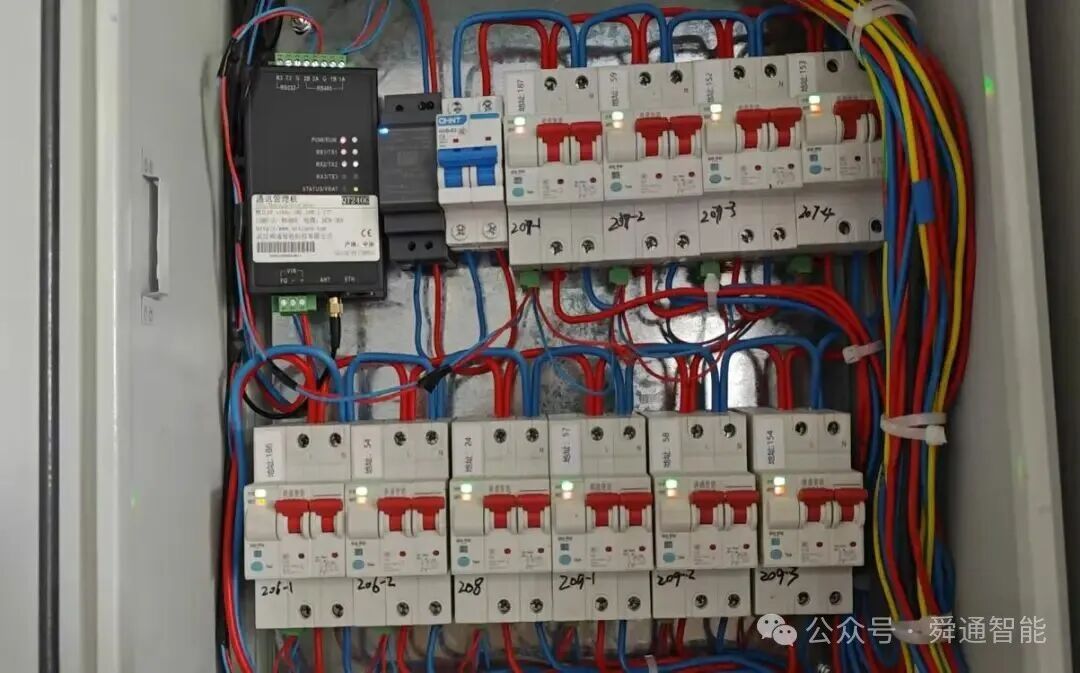
Intelligent air switch+intelligent gateway
Air conditioning section

Current situation of multi split central air conditioning
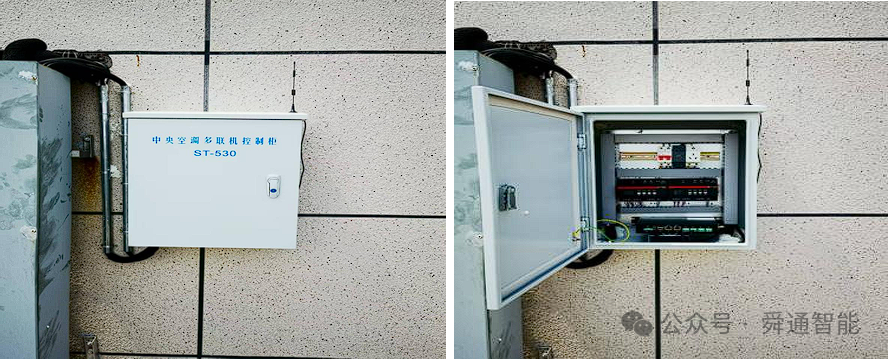
Multi split control cabinet+multi split controller+intelligent gateway
power distribution system

High and low voltage distribution room
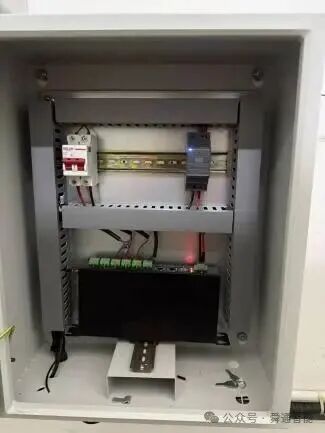
Communication Management Unit
charging pile system
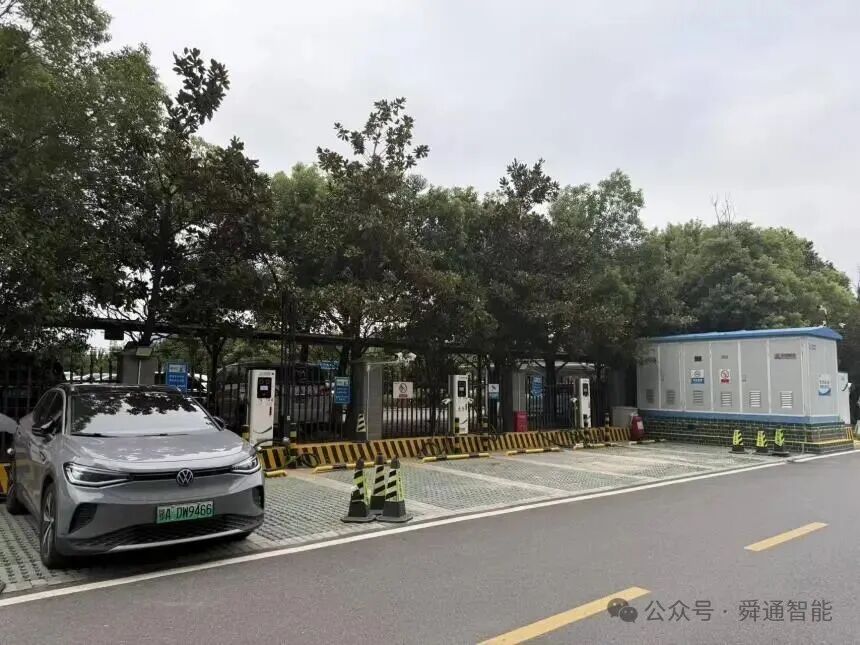
Outdoor parking lot charging station
VIIntroduction to Platform Functions
Integrated large screen
Display site information, number of transformers, number of equipment, alarm overview, operation and maintenance work order overview, carbon emission data, and electricity data. Customized development can also be carried out according to project requirements.

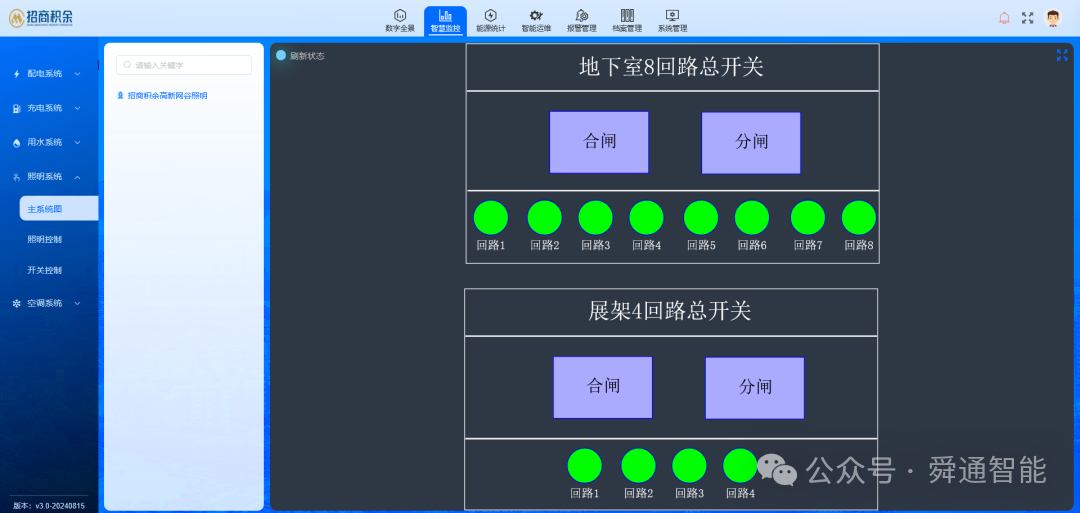
Main system diagram
Display electrical configuration diagrams drawn and uploaded by users using QTouch, support association with data, and provide animation effects and event response functions. Users can view real-time changes in the status of electrical equipment, execute dynamic animations, and trigger specific events through interactive operations, enhancing the visualization and operational experience of the system.

historical curve
Display the electrical parameter data curves of all monitoring circuits under the associated site, including real-time fluctuations of key electrical parameters such as voltage, current, power, and frequency. By visualizing curves, users can intuitively monitor the trend of electrical parameter changes in each circuit, helping to detect abnormal fluctuations or faults in a timely manner and ensuring the stable operation of the system. At the same time, users can choose to view data for specific circuits as needed for more detailed analysis and comparison.
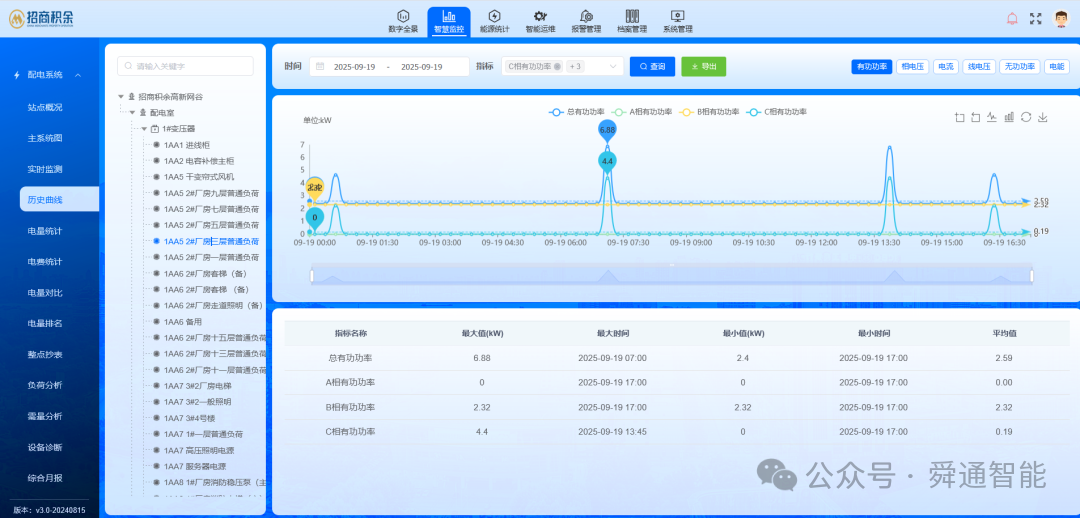
lighting system
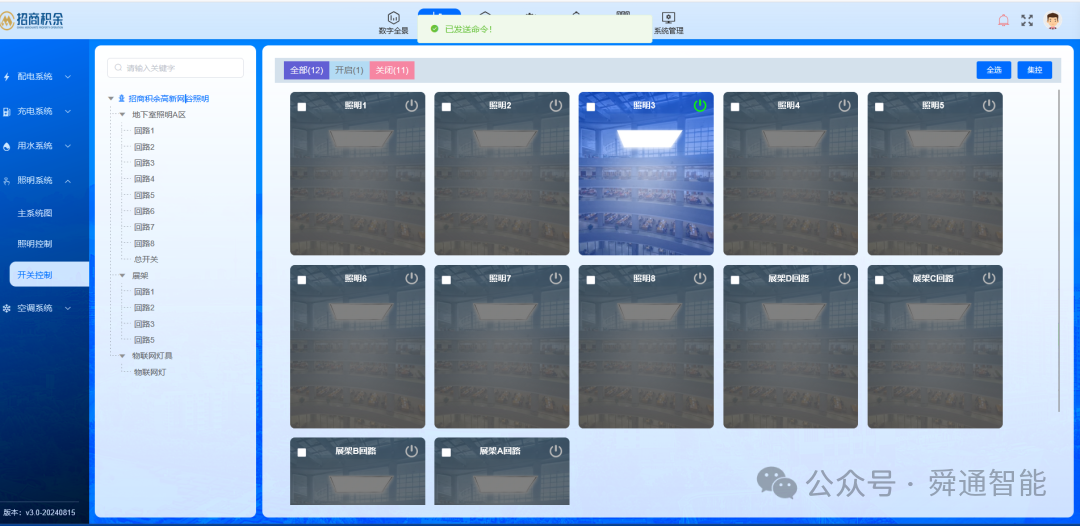
One click start can be achieved through a single image, and configuration can also be done through QTouch, with different control methods set for different regions.
Single lamp control or loop control can be remotely performed, and mode settings can also be made, such as constant light mode, sensing mode, and constant on mode.
air conditioning system
It displays the real-time operating status of all air conditioning equipment at the selected site, and presents in detail the key data collected by each equipment, including temperature, wind speed, operating mode, etc. Through an intuitive interface, users can monitor the performance of various air conditioning equipment in real time, ensuring the normal and efficient operation of the equipment
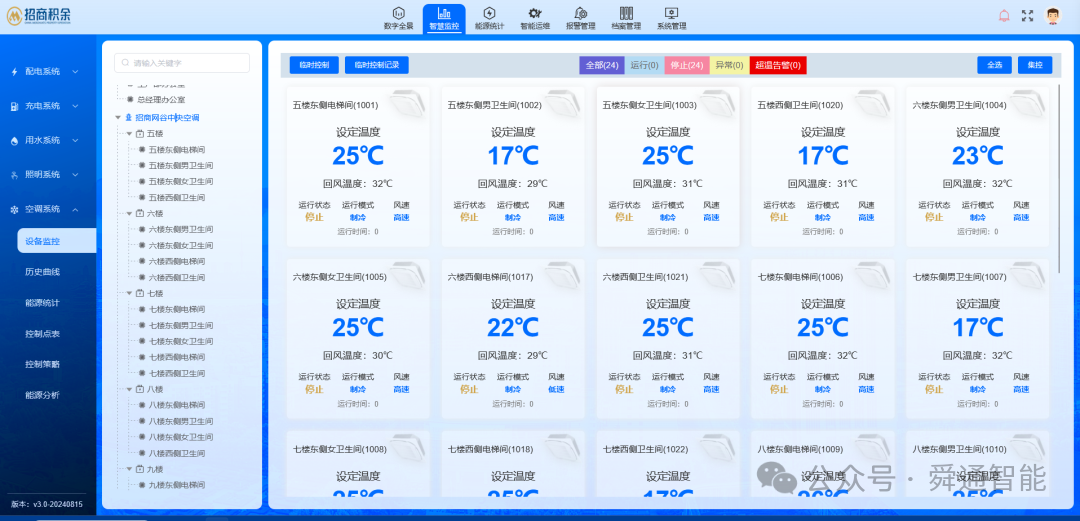
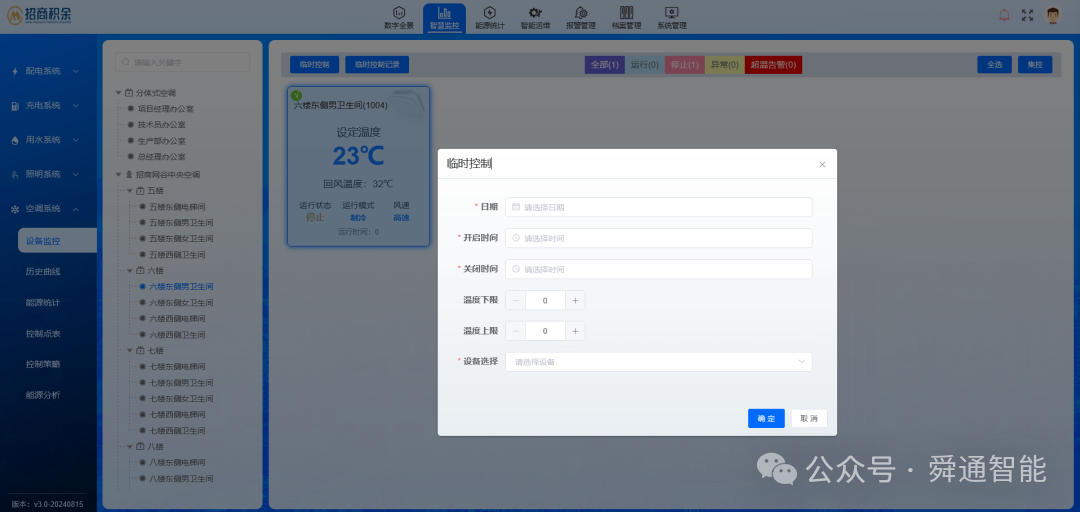
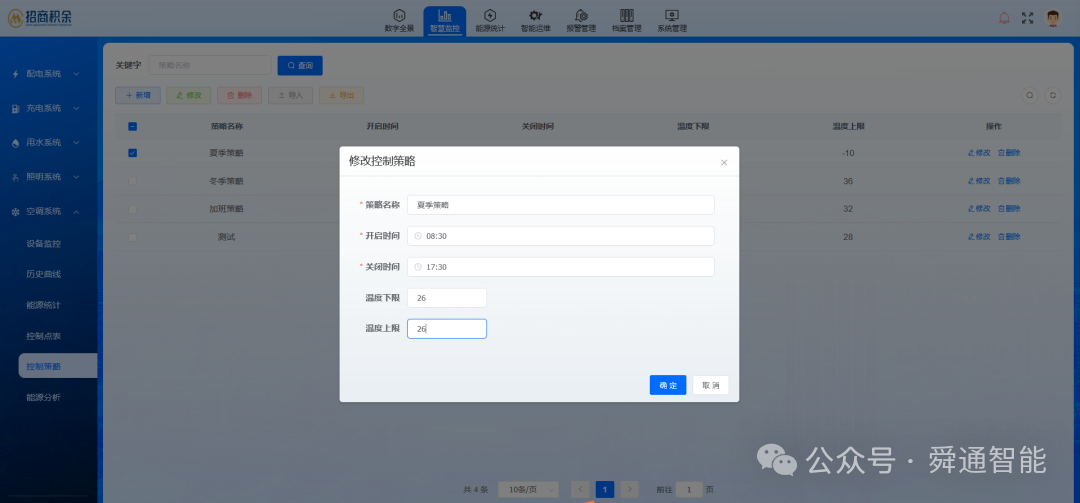
It is possible to implement individual control strategies for a certain internal machine, or set control strategies for a project.
Closing remarks:The energy management system can automatically generate reports that meet regulatory requirements (such as energy consumption statistics reports for key energy consuming units and energy intensity change trend tables), avoiding errors and omissions in manual statistics, ensuring that enterprises complete data reporting on time and accurately, and avoiding fines or credit risks caused by compliance issues.
In the context of the "carbon peak and carbon neutrality" strategy, the green transformation of enterprises has shifted from an "optional action" to a "mandatory action", and energy consumption data is the core foundation of carbon emission accounting (such as indirect carbon emissions corresponding to electricity consumption and direct carbon emissions corresponding to natural gas consumption).
The system accurately records the consumption of various energy types, which can be automatically converted into corresponding carbon emissions (such as 1 kWh of electricity ≈ 0.785kg of carbon dioxide), generating a carbon emission ledger for enterprises. This provides data support for setting carbon reduction targets in the future (such as "reducing carbon emissions by 12% in 2027 compared to 2023"), applying for green factory/low-carbon enterprise certification, and helping enterprises achieve dual benefits of "green development" and "brand value enhancement".